

Observability
ZaneOps ships with two optional observability stacks you can deploy on demand:
- OpenTelemetry tracing: trace the HTTP requests served by ZaneOps down to the SQL and Redis queries they trigger, in Grafana.
- Temporal UI: inspect the Temporal workflows behind deployments, scheduled jobs and other background tasks.
Quick start
Section titled “Quick start”Run these from your installation directory (e.g. /var/www/zaneops), the same place you run make deploy.
Enable tracing
Section titled “Enable tracing”-
Deploy the tracing stack (
zane-otel):Terminal window make deploy-otel -
Uncomment these variables in your
.envfile:.env OTEL_TRACES_ENABLED="true"OTEL_EXPORTER_OTLP_ENDPOINT="http://zane.tempo:4317"Optionally set the Grafana admin credentials (defaults are
admin/change-me-please):.env GRAFANA_ADMIN_USER="admin"GRAFANA_ADMIN_PASSWORD="a-strong-password" -
Re-deploy ZaneOps so the app and workers start emitting traces:
Terminal window make deploy
To stop: run make stop-otel, comment back the OTEL_* variables and run make deploy again.
Enable the Temporal UI
Section titled “Enable the Temporal UI”make deploy-temporal-uiThis deploys the zane-temporal stack and connects to the existing Temporal server, so no .env change is required. To stop: make stop-temporal-ui.
What you get
Section titled “What you get”OpenTelemetry tracing
Section titled “OpenTelemetry tracing”The tracing stack instruments the HTTP requests made to ZaneOps. For each request you get a span tree that includes the SQL queries and Redis (Valkey) queries it ran, both on their own and scoped to the request that triggered them. This makes it easy to spot slow endpoints, N+1 queries or unexpected cache access.
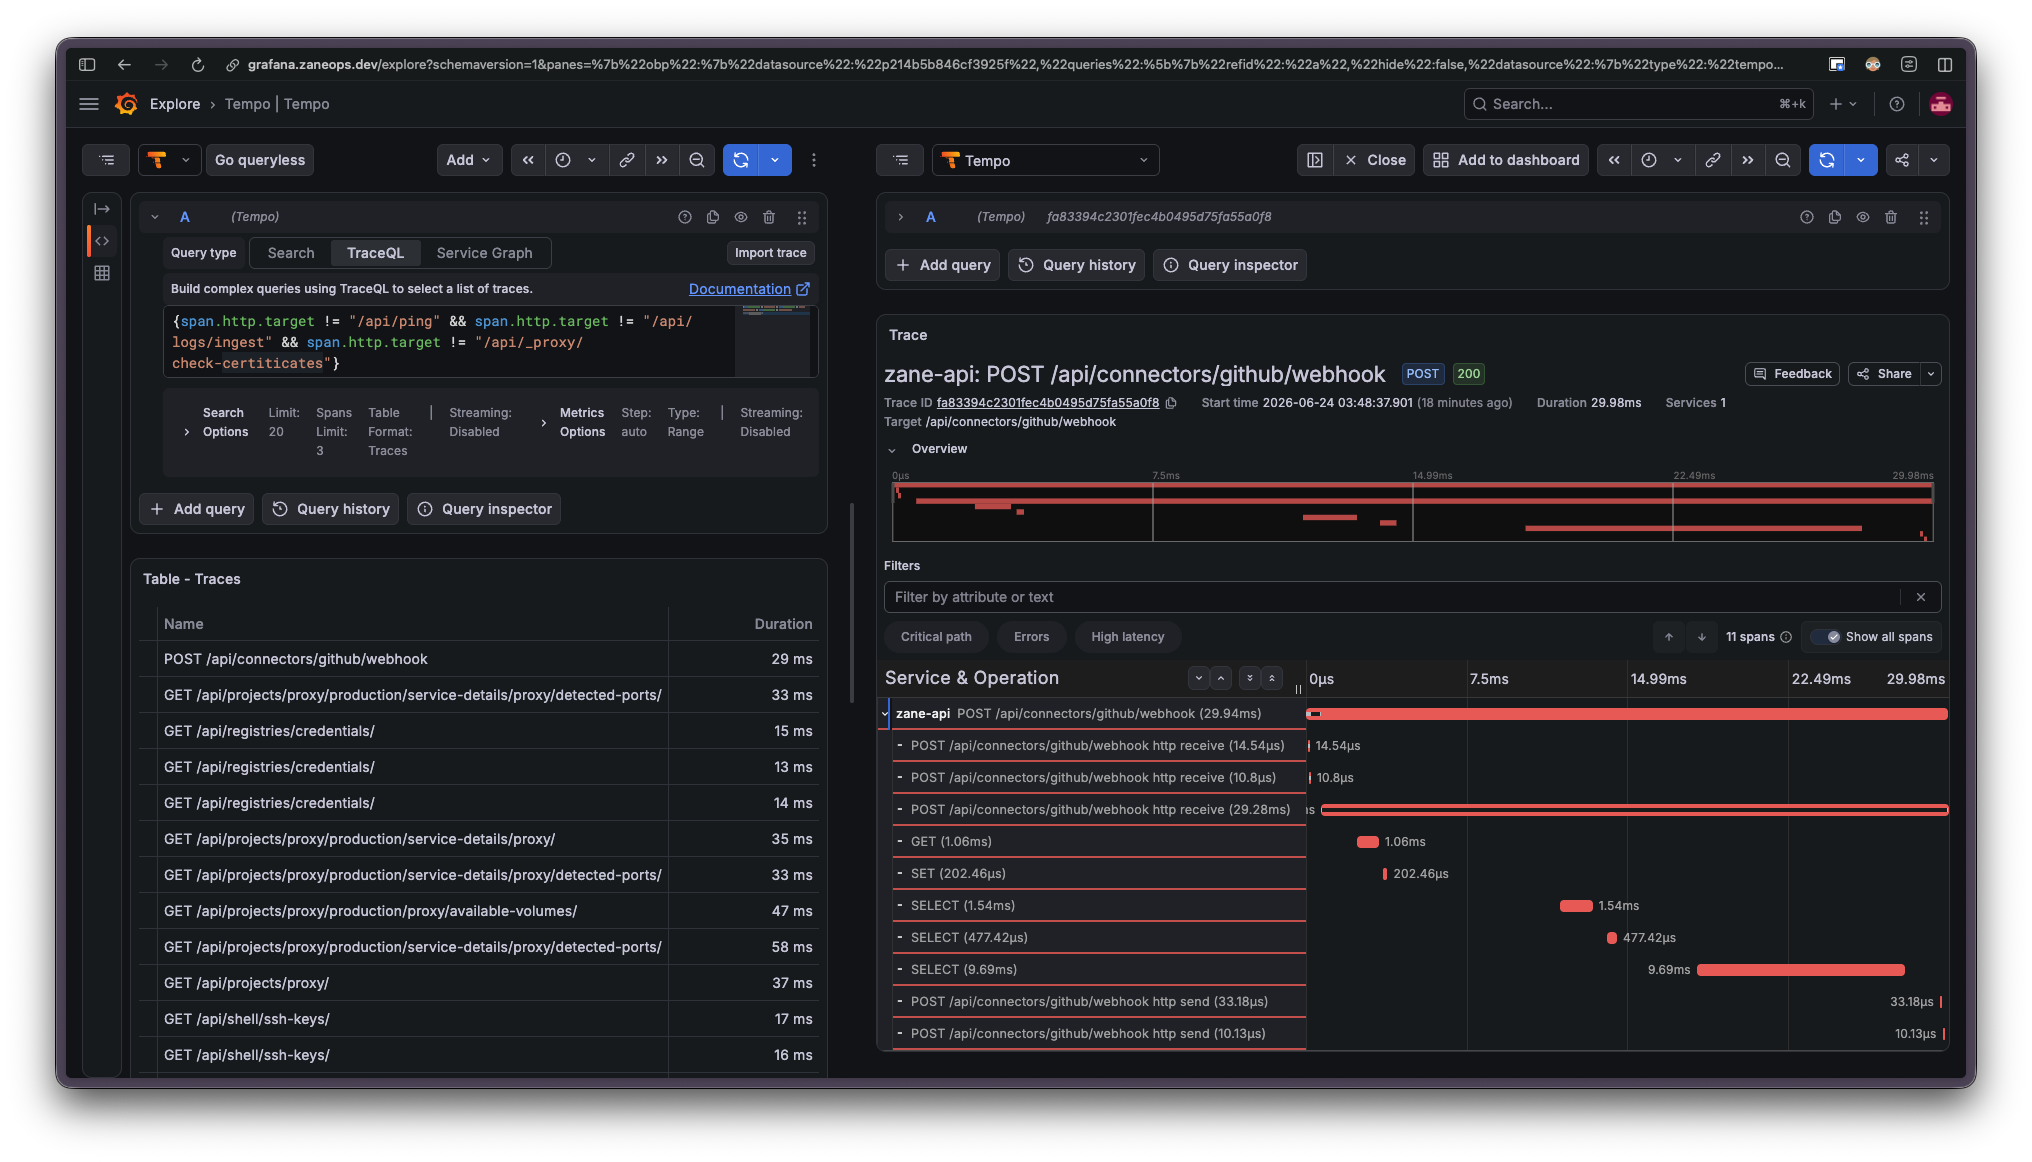
It is made of two services, deployed as the zane-otel stack on the existing zane overlay network:
| Service | Image | Role |
|---|---|---|
zane-tempo | grafana/tempo | Receives and stores traces (OTLP gRPC on :4317, HTTP on :4318) |
zane-grafana | grafana/grafana | UI to explore traces, pre-provisioned with Tempo and Loki datasources |
Temporal UI
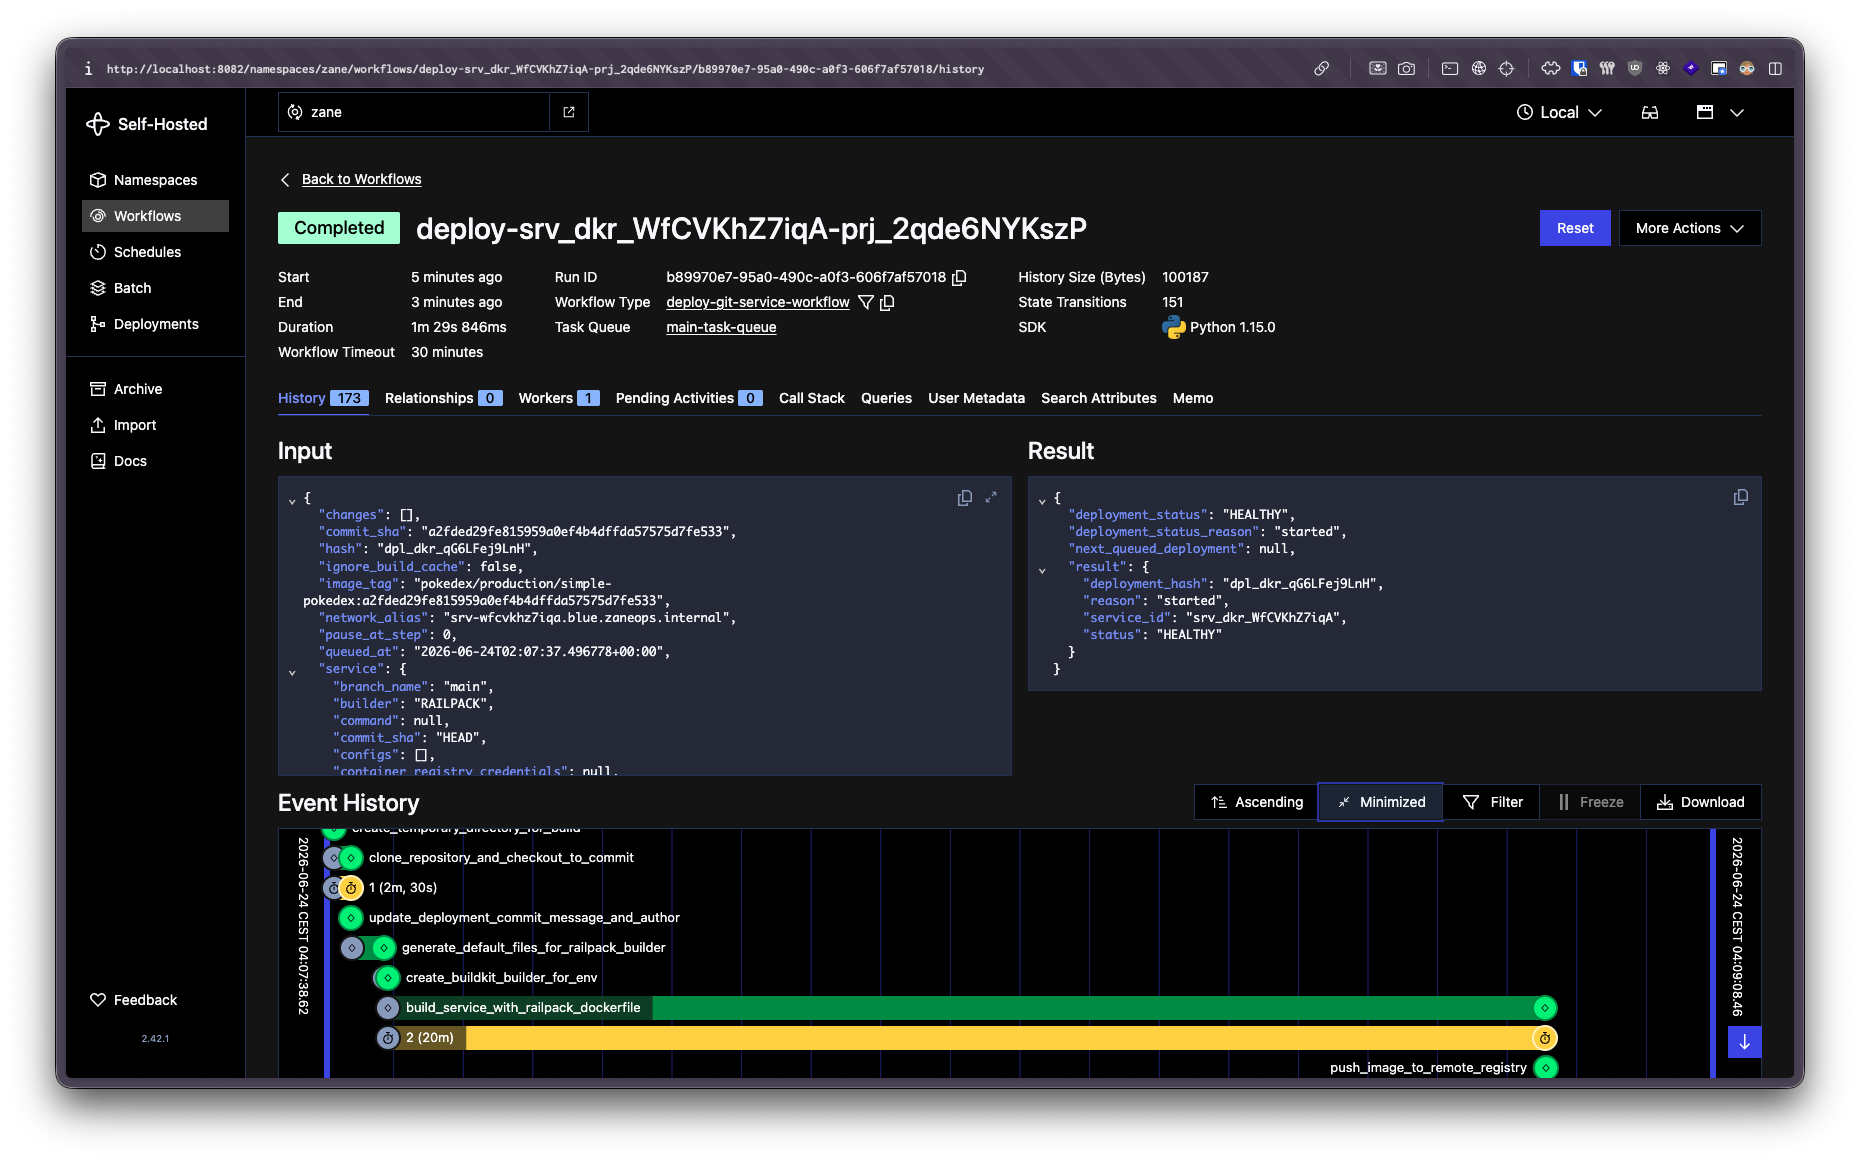
Section titled “Temporal UI”The Temporal UI lets you inspect the workflows and activities that ZaneOps runs in the background (deployments, scheduled jobs, cleanup tasks…). It’s useful to follow a deployment step by step or to understand why a background task failed.
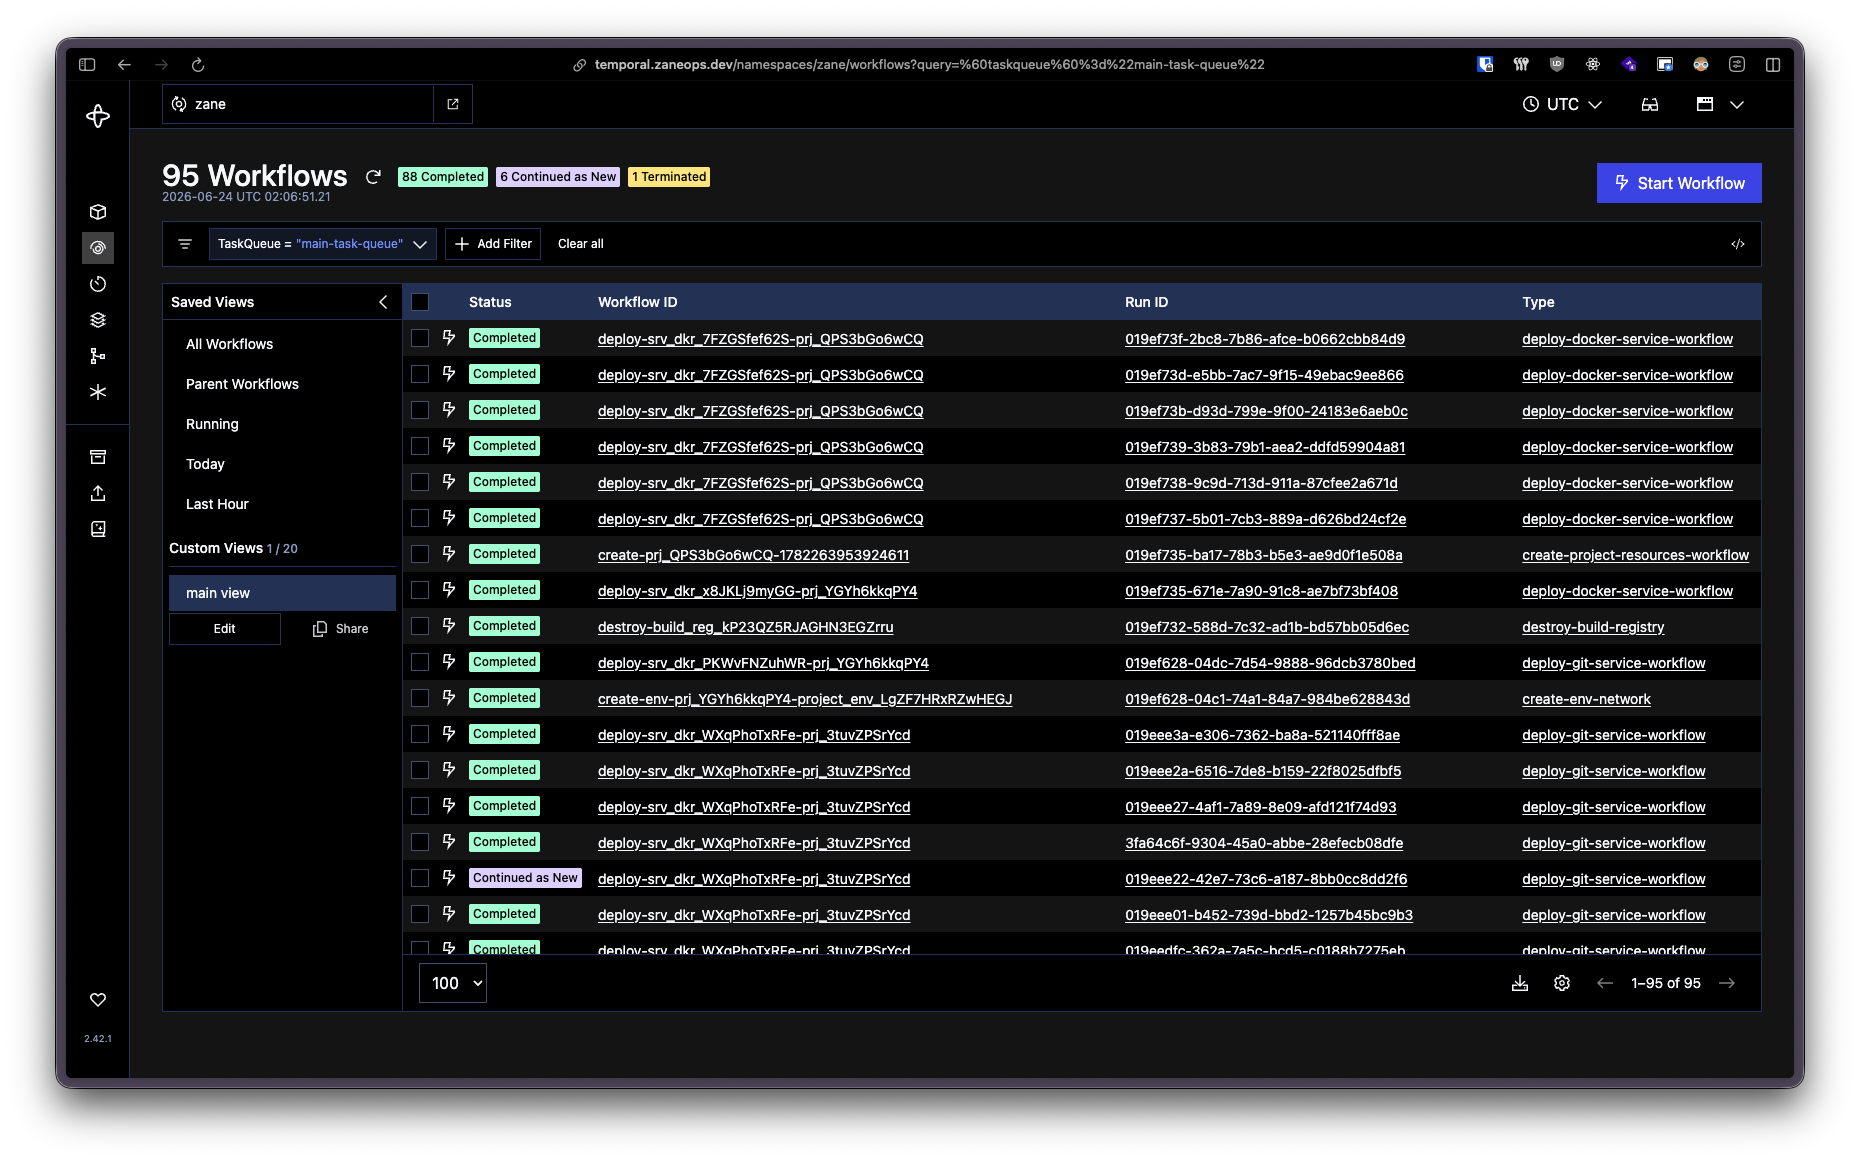
It’s a single service, deployed as the zane-temporal stack:
| Service | Image | Role |
|---|---|---|
temporal-ui | temporalio/ui | Web UI connected to the Temporal server at zane.temporal:7233 |
Accessing the dashboards
Section titled “Accessing the dashboards”By default, neither Grafana nor the Temporal UI publishes a port: they’re only reachable from inside
the zane overlay network. This is intentional, since these dashboards expose sensitive internals and should
not be open to the public internet.
How you access them depends on how long you plan to keep them around:
| Dashboard | Stack | Service alias | Internal port | Default published port |
|---|---|---|---|---|
| Grafana (tracing) | zane-otel | zane-grafana | 3000 | 3004 |
| Temporal UI | zane-temporal | zane.temporal_ui | 8080 | 8080 |
If you only need the dashboard for a short debugging session, uncomment the published port in the corresponding stack file and re-deploy the stack.
For Grafana, edit docker-stack.prod-otel.yaml:
zane-grafana: # ... ports: - "3004:3000"Then re-deploy and open http://<SERVER_IP>:3004:
make deploy-otelTo keep a dashboard available long-term behind a domain with HTTPS, expose it through a small reverse
proxy (caddy or nginx) that you deploy inside ZaneOps and point at the dashboard’s network alias.
ZaneOps’ own proxy (Caddy) issues and renews the TLS certificate for the domain automatically, so the inner proxy only needs to listen on plain HTTP. This is the same “proxy inception” pattern used elsewhere, spelled out end-to-end below.
-
In the ZaneOps dashboard, create a new service from the
caddy:alpineornginx:alpineDocker image. -
Add a config file to the service (in its Settings → Configs), with one entry per dashboard you want to expose:
Mount at
/etc/caddy/Caddyfile. Thehttp://prefix tells Caddy to serve plain HTTP and skip its own TLS, since ZaneOps’ proxy already terminates HTTPS:/etc/caddy/Caddyfile http://grafana.example.com {# Optional basic auth. Generate the hash with: caddy hash-password# basic_auth {# admin <bcrypt-hash># }reverse_proxy zane-grafana:3000}http://temporal.example.com {# Optional basic auth. Generate the hash with: caddy hash-password# basic_auth {# admin <bcrypt-hash># }reverse_proxy zane.temporal_ui:8080}Mount at
/etc/nginx/conf.d/default.conf:/etc/nginx/conf.d/default.conf server {listen 80;server_name grafana.example.com;# Optional basic auth. Generate the file with: htpasswd -c /etc/nginx/.htpasswd admin# auth_basic "Restricted";# auth_basic_user_file /etc/nginx/.htpasswd;location / {proxy_pass http://zane-grafana:3000;proxy_set_header Host $host;proxy_set_header X-Real-IP $remote_addr;proxy_set_header X-Forwarded-For $proxy_add_x_forwarded_for;proxy_set_header X-Forwarded-Proto $scheme;}}server {listen 80;server_name temporal.example.com;# Optional basic auth. Generate the file with: htpasswd -c /etc/nginx/.htpasswd admin# auth_basic "Restricted";# auth_basic_user_file /etc/nginx/.htpasswd;location / {proxy_pass http://zane.temporal_ui:8080;proxy_set_header Host $host;proxy_set_header X-Real-IP $remote_addr;proxy_set_header X-Forwarded-For $proxy_add_x_forwarded_for;proxy_set_header X-Forwarded-Proto $scheme;}} -
Attach your domains (e.g.
grafana.example.com,temporal.example.com) to the service in its settings, and ZaneOps issues the TLS certificates automatically. -
Deploy the service.