Troubleshooting
In this section, we provides solutions for resolving issues you might encounter with ZaneOps.
ZaneOps installation is stuck
Section titled “ZaneOps installation is stuck”ZaneOps typically takes less than 5 minutes to start. If it’s stuck longer than that, it may be due to several possible issues.
# make deploy====== Deploying ZaneOps with HTTPS 🔒 ======# other logs...🏁 Deploy initiatedWaiting for all services to reach desired state, this should take less than 5 minutes... ◐General debugging steps
Section titled “General debugging steps”To check that ZaneOps started correctly:
-
You need to verify that all ZaneOps docker services started correctly:
Terminal window docker service ls --filter label="com.docker.stack.namespace=zane"You should have an output like this in the terminal where
1/1means OK except forzane_zane-temporal-admin-toolswhich should be0/1 (1/1 completed):Terminal window ID NAME MODE REPLICAS IMAGE PORTSinpyph774s3l zane_zane-app replicated 1/1 ghcr.io/zane-ops/app:canaryotewzijsmzaj zane_zane-db replicated 1/1 postgres:16-alpineadv0qcj7fqga zane_zane-fluentd replicated 1/1 fluentd:v1.16.2-1.1fa7t7r508bd9 zane_zane-loki replicated 1/1 grafana/loki:3.4kisb92em589i zane_zane-pgbouncer replicated 1/1 edoburu/pgbouncer:v1.23.1-p3t432gf67whmx zane_zane-proxy replicated 1/1 ghcr.io/zane-ops/proxy:canaryux5vuucsm9cv zane_zane-temporal-admin-tools replicated job 0/1 (1/1 completed) temporalio/admin-tools:1.24.2-tctl-1.18.1-cli-1.0.0flwwyuihygay zane_zane-temporal-main-worker replicated 1/1 ghcr.io/zane-ops/app:canarywldqkpahhuyr zane_zane-temporal-schedule-worker replicated 1/1 ghcr.io/zane-ops/app:canarym8wk18qer4ys zane_zane-temporal-server replicated 1/1 temporalio/auto-setup:1.24.2limmbrl9o0ub zane_zane-valkey replicated 1/1 valkey/valkey:7.2.5-alpine -
If one of the services is not starting correctly, you can check the tasks for the service with:
Terminal window docker service ps zane_zane-{service} # ex: `zane_zane-app`You should get an output similar to this where the latest task (the first task from the top) state is
Running:Terminal window ID NAME IMAGE NODE DESIRED STATE CURRENT STATE ERROR PORTS7b21smevkj6l zane_zane-app.1 ghcr.io/zane-ops/app:canary ubs01 Running Running 2 hours agoppfheeofce3t \_ zane_zane-app.1 ghcr.io/zane-ops/app:canary ubs01 Shutdown Shutdown 2 hours ago -
If the latest task state show
Failed, you can check the logs of the failed status:Terminal window docker inspect --format '{{ json .Status }}' <TASK-ID> | jq # ex: `7b21smevkj6l` the ID aboveYou will get a JSON object like this:
{"Timestamp": "2025-07-16T19:31:21.277975012Z","State": "failed","Message": "started","Err": "No such container: zane_zane-app.1.ypqk8horkrofmsij7r6xtn7kf",// ... other fields}The
Errfield might have a full explanation of the error.Examples:
- “no suitable node (host-mode port already in use on 1 node)”: meaning the port is already used by another service
- “invalid pool request: Pool overlaps with other one in this address space”: meaning the address pool (subnet) is already used by another network
-
You can also see the application logs of the services using:
Terminal window docker service logs zane_zane-{service} -
Still stuck? create an issue
Going further with observability
Section titled “Going further with observability”For deeper debugging, ZaneOps ships two optional observability stacks you can deploy on demand:
-
OpenTelemetry tracing (Grafana + Tempo): trace the HTTP requests served by ZaneOps down to the SQL and Redis queries they trigger (
make deploy-otel).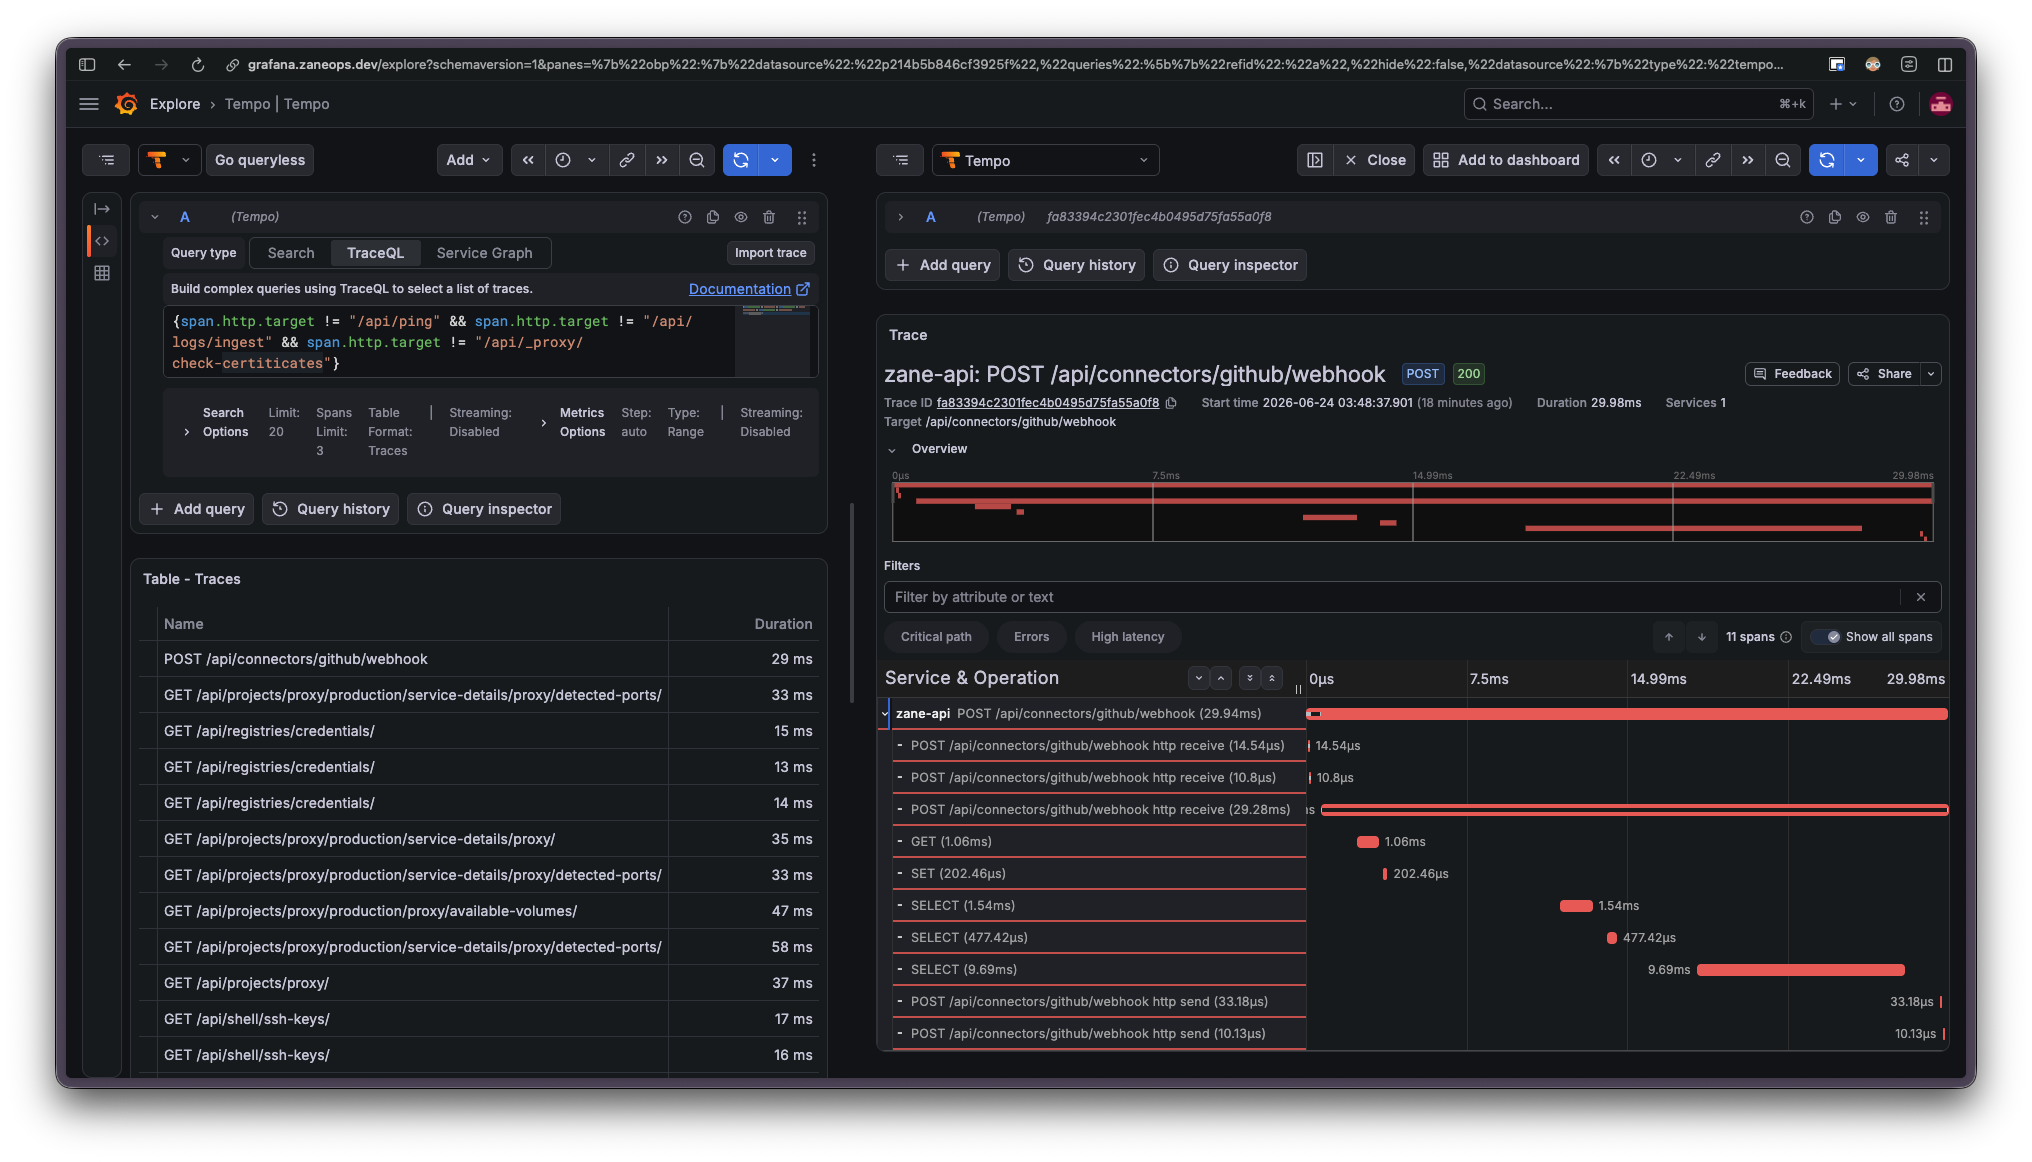
-
Temporal UI: inspect the background workflows behind deployments and scheduled jobs (
make deploy-temporal-ui).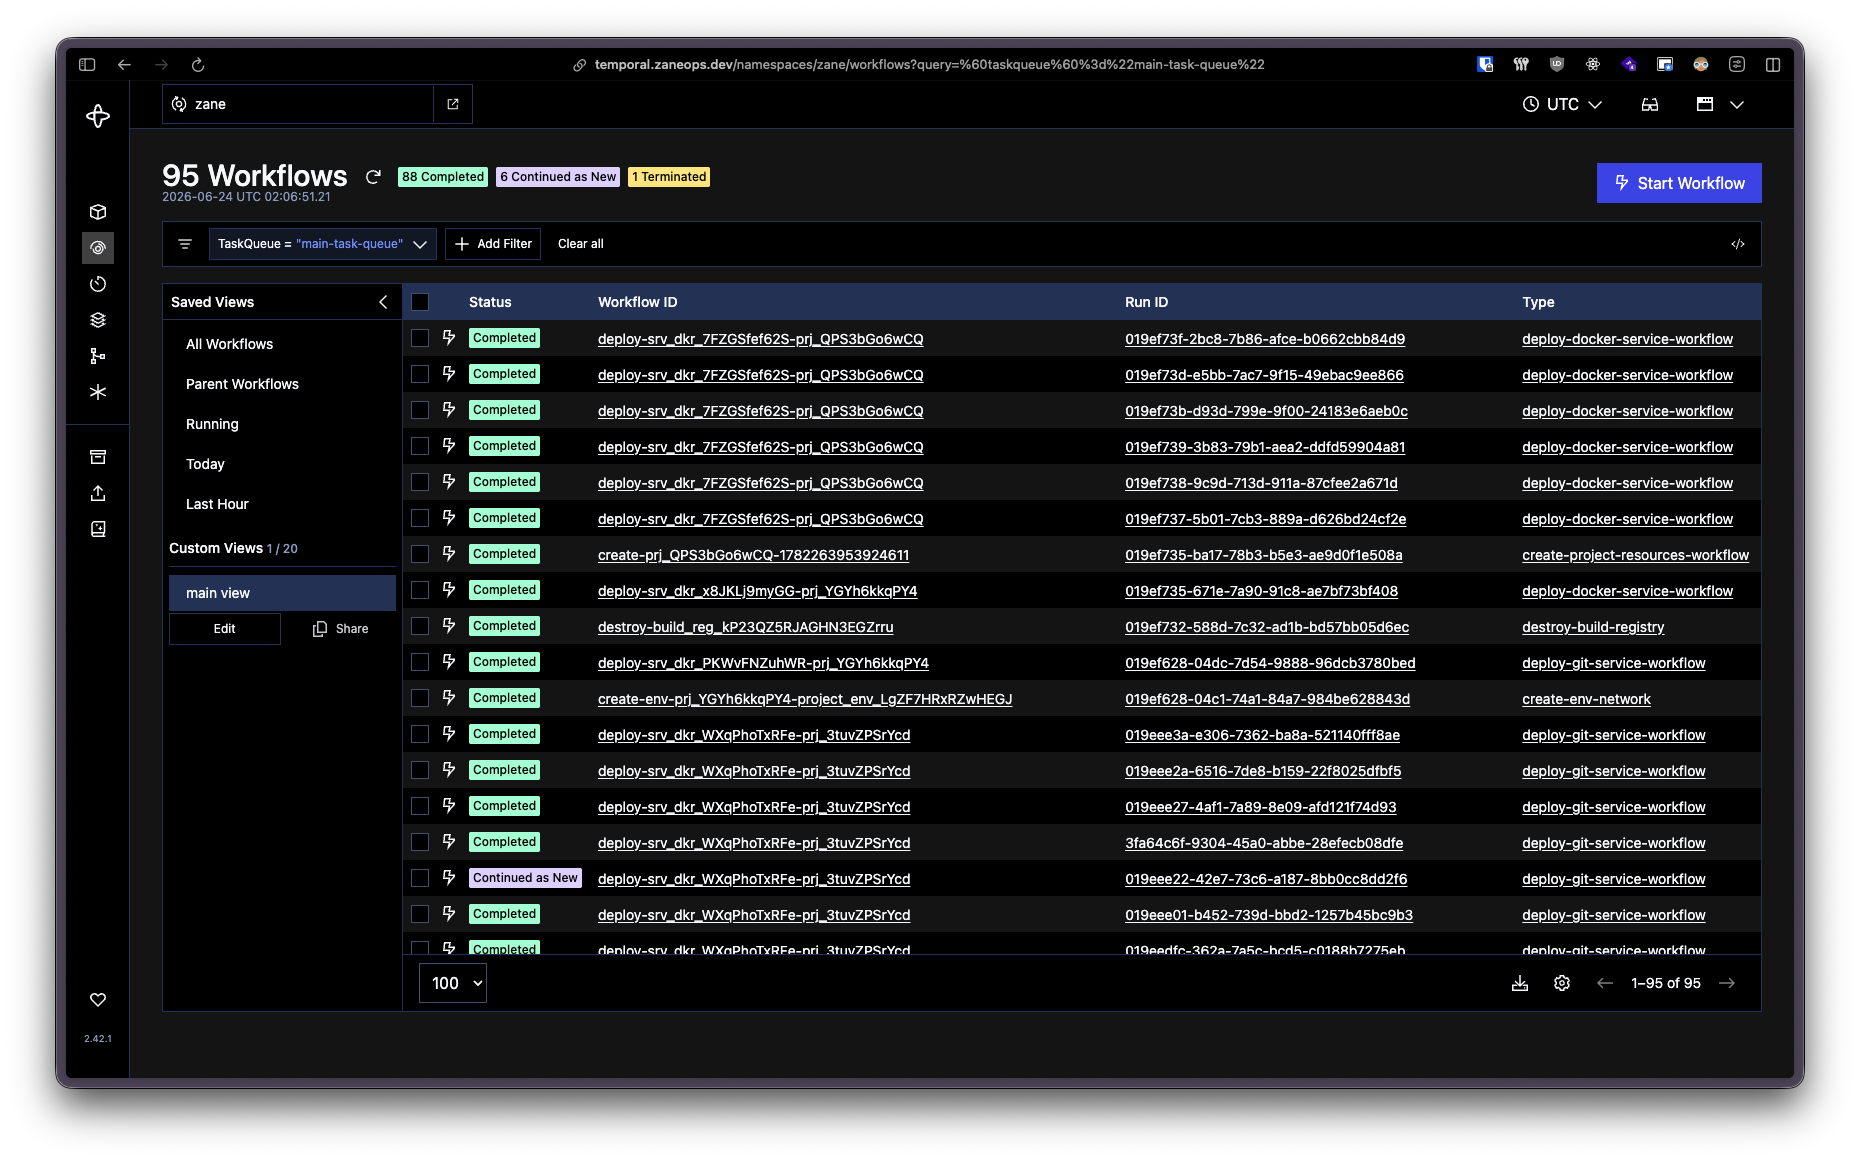
Something is running on either port 80 or 443
Section titled “Something is running on either port 80 or 443”ZaneOps’ proxy (Caddy) uses ports 80 & 443 to expose applications. If another app is using these ports, ZaneOps won’t start.
If you must use another proxy alongside ZaneOps, you can run it as a service inside ZaneOps and proxy requests internally using the service’s network alias:
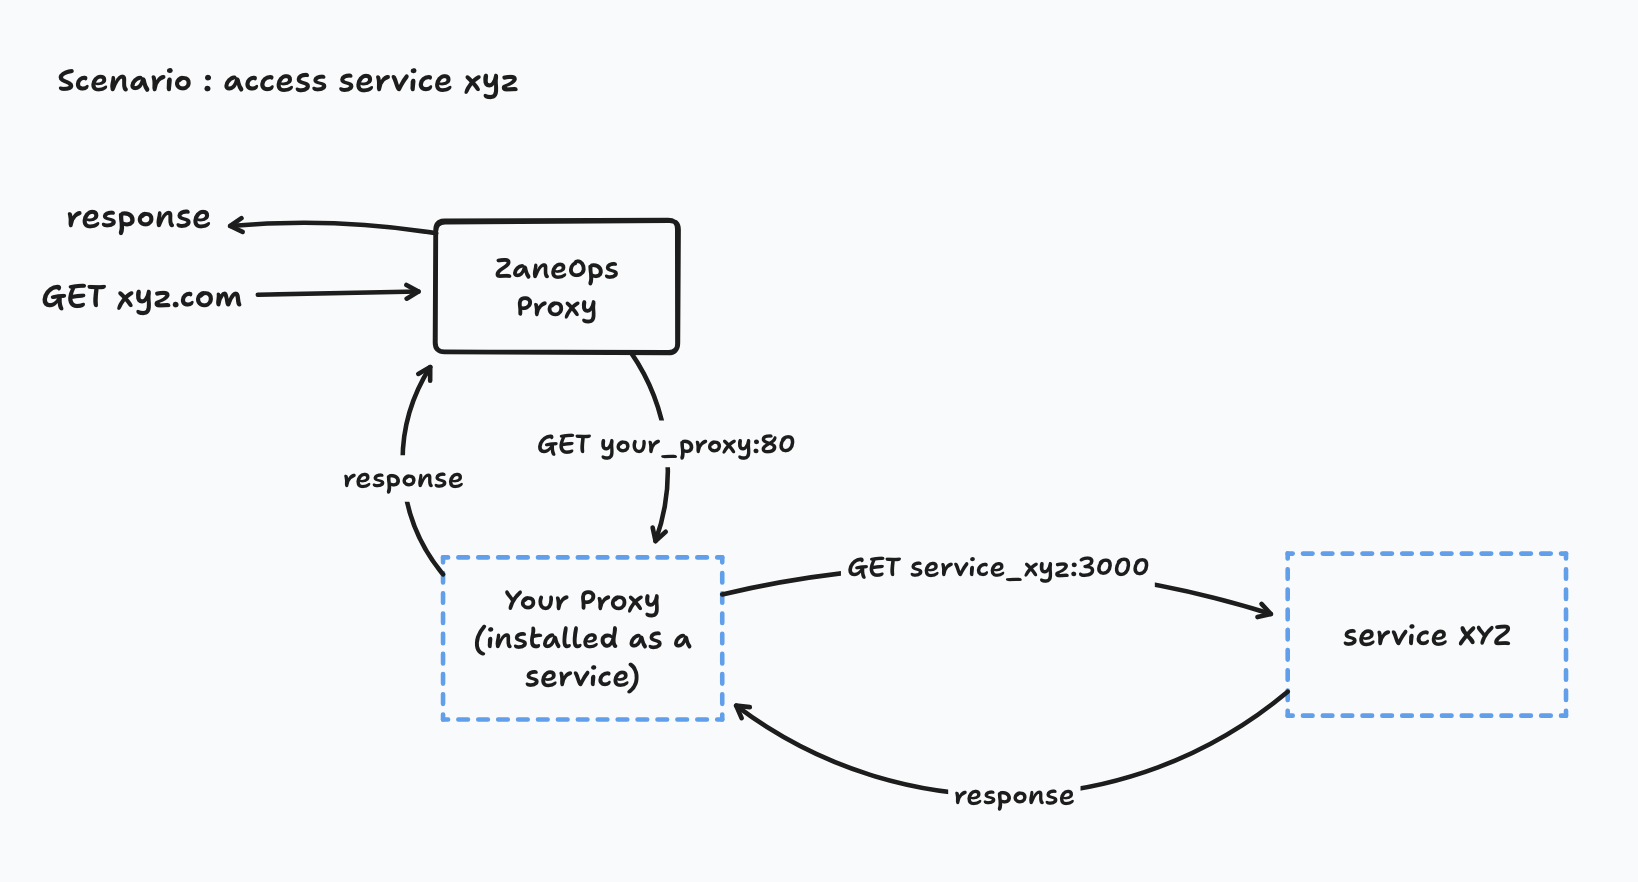
server {    listen 80;    server_name xyz.com;
    location / {
        proxy_pass http://service-xyz.zaneops.internal:80;        proxy_set_header Host $host;        proxy_set_header X-Real-IP $remote_addr;        proxy_set_header X-Forwarded-For $proxy_add_x_forwarded_for;        proxy_set_header X-Forwarded-Proto $scheme;    }}
Another network already uses the subnet
Section titled “Another network already uses the subnet”ZaneOps services share a common docker network: zane
If another network already uses its subnet, ZaneOps won’t start.
First list all docker networks and their subnets:
docker network ls -q | xargs docker network inspect -f '{{.Name}}: {{range .IPAM.Config}}{{.Subnet}}{{end}}'You should see zane network and another one sharing the same subnet:
bridge: 10.0.0.0/24host:none:my_network: 10.0.1.0/24zane: 10.0.1.0/24Make sure to stop all ZaneOps remaining processes:
# assuming you are in /var/www/zaneopsmake stopYou can proceed to delete zane network:
docker network rm zaneThen recreate the network with a subnet not in use, for example: 172.28.0.0/16
docker network create --attachable --driver overlay --label zane.stack=true --subnet 172.28.0.0/16 zaneRestart ZaneOps
# assuming you are in /var/www/zaneopsmake deployYou are connected to GitHub Container Registry (ghcr.io)
Section titled “You are connected to GitHub Container Registry (ghcr.io)”ZaneOps images are hosted on GitHub Container Registry (public). Auth conflicts may happen if your token is not longer valid.
To check if you are connected:
cat ~/.docker/config.jsonIf ghcr.io appear in the auths key, you are authenticated to GitHub container:
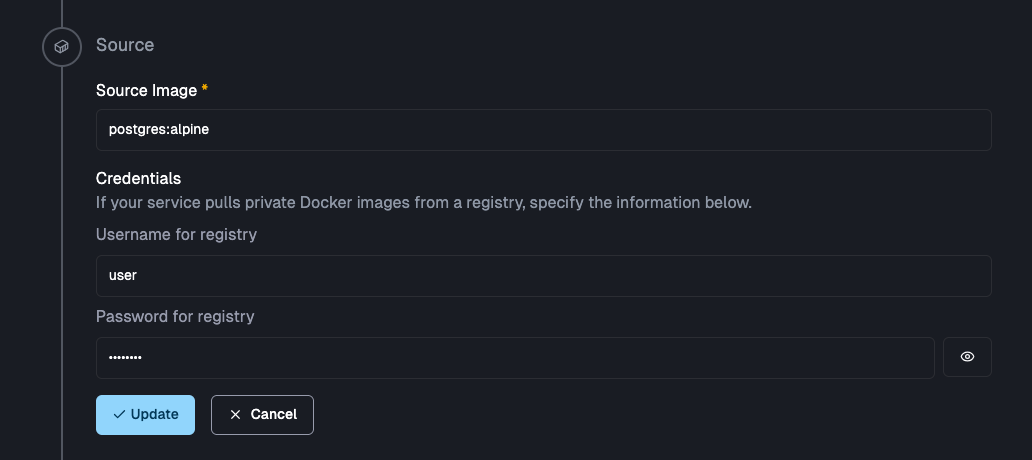
{ "auths": { "https://ghcr.io": {} }, // other keys ...}Note that you can also deploy any application hosted on a private container registry by specifying the credentials in the source in the service settings page:
Issues with a VPN
Section titled “Issues with a VPN”You might get this error if you have a VPN installed:
$ docker inspect --format '{{ json .Status }}' <task-id> | jq
{        "Timestamp": "2025-07-16T19:31:21.277975012Z",        "State": "failed",        "Message": "started",        "Err": "network sandbox join failed: subnet sandbox join failed for \"10.0.1.0/24\": error creating vxlan interface: operation not supported",        # ... other fields}
This error means Docker couldn’t create a VXLAN interface—usually due to missing kernel modules or VPN conflicts.
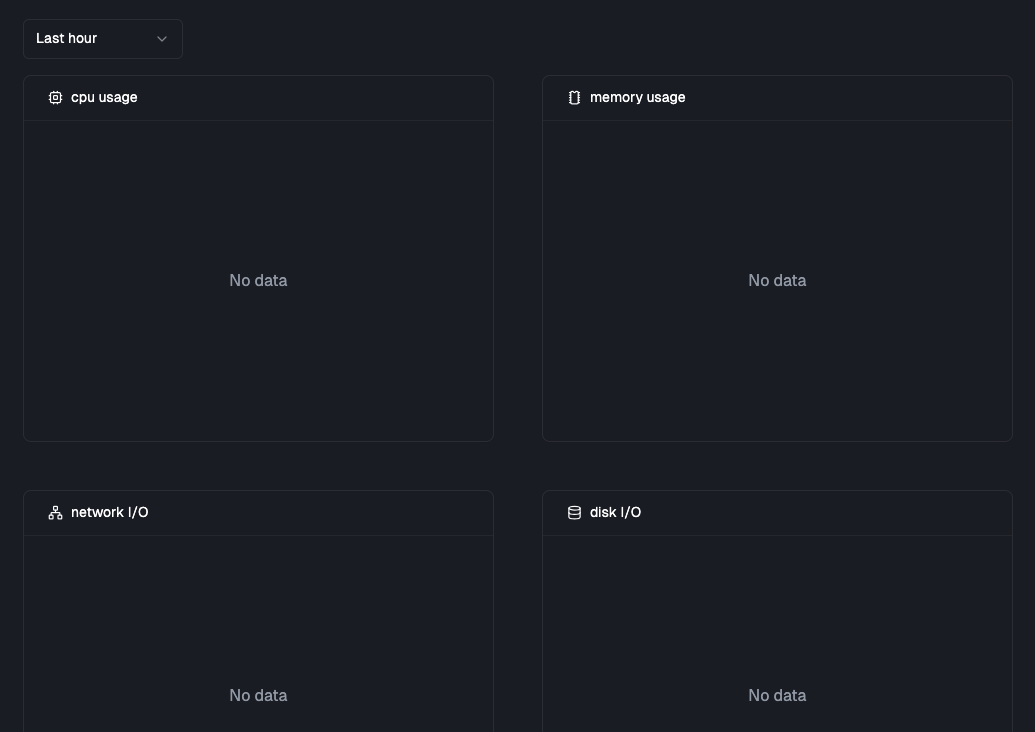
Service metrics aren’t shown in the dashboard
Section titled “Service metrics aren’t shown in the dashboard”If your app deployed successfully but no metrics appear (usually after ~30s), it may be because cgroups are not enabled on your server.